Operations control
Every number in your commercial operation, up to date and compared against four periods, with the detail each person needs: management sees the network, the supervisor their team and the sales rep their customers.
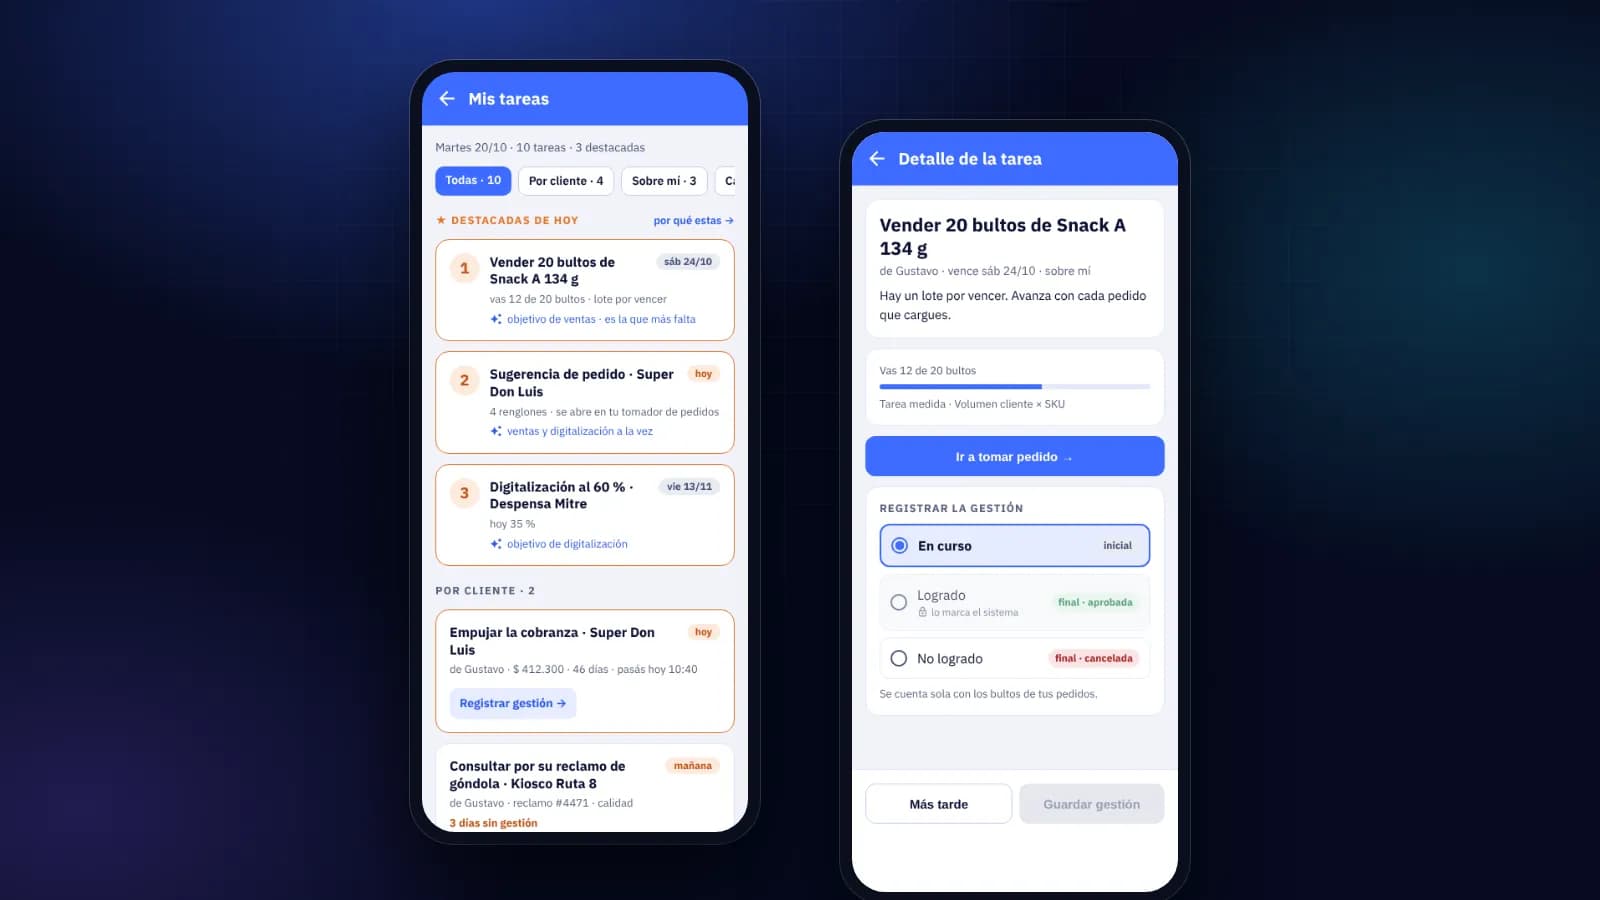
Tracy screens with sample data.
How many spreadsheets get cross-checked every Monday to build the sales report?
Do you find out a customer stopped buying when it's already too late?
Does each department look at a different number for the same sale?
Does your analytics tool show the same thing your team sees in the field?
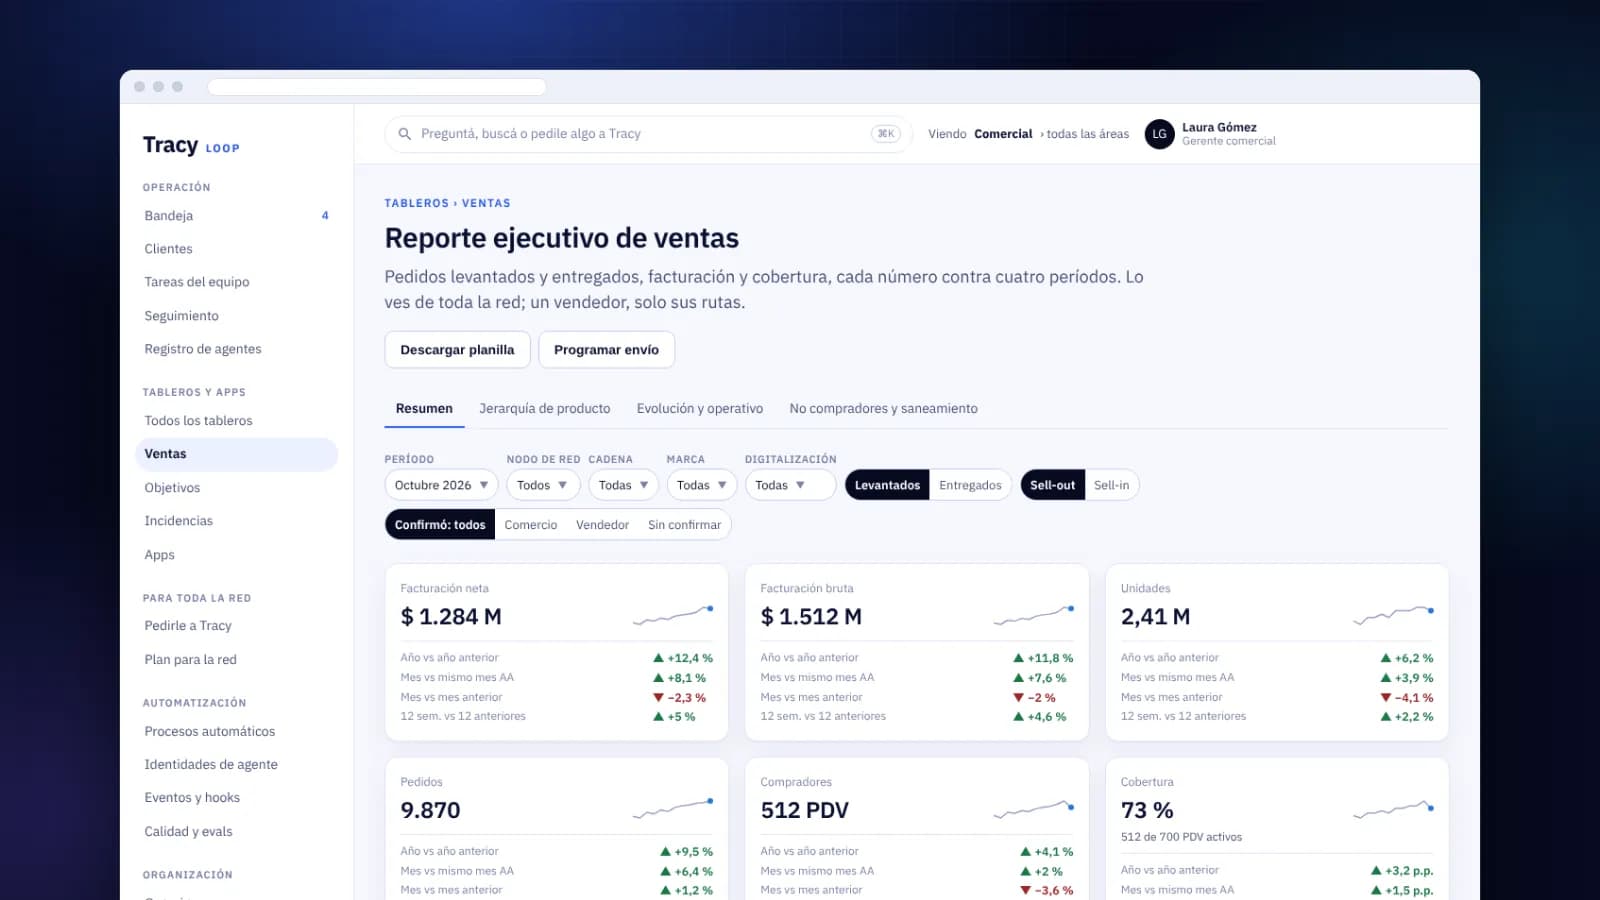
Revenue, orders, units, buyers and coverage, each compared against the previous year, the same month, the previous month and the last 12 weeks.
The progress of each campaign by structure, from the network down to the sales rep, in a grid that expands level by level.
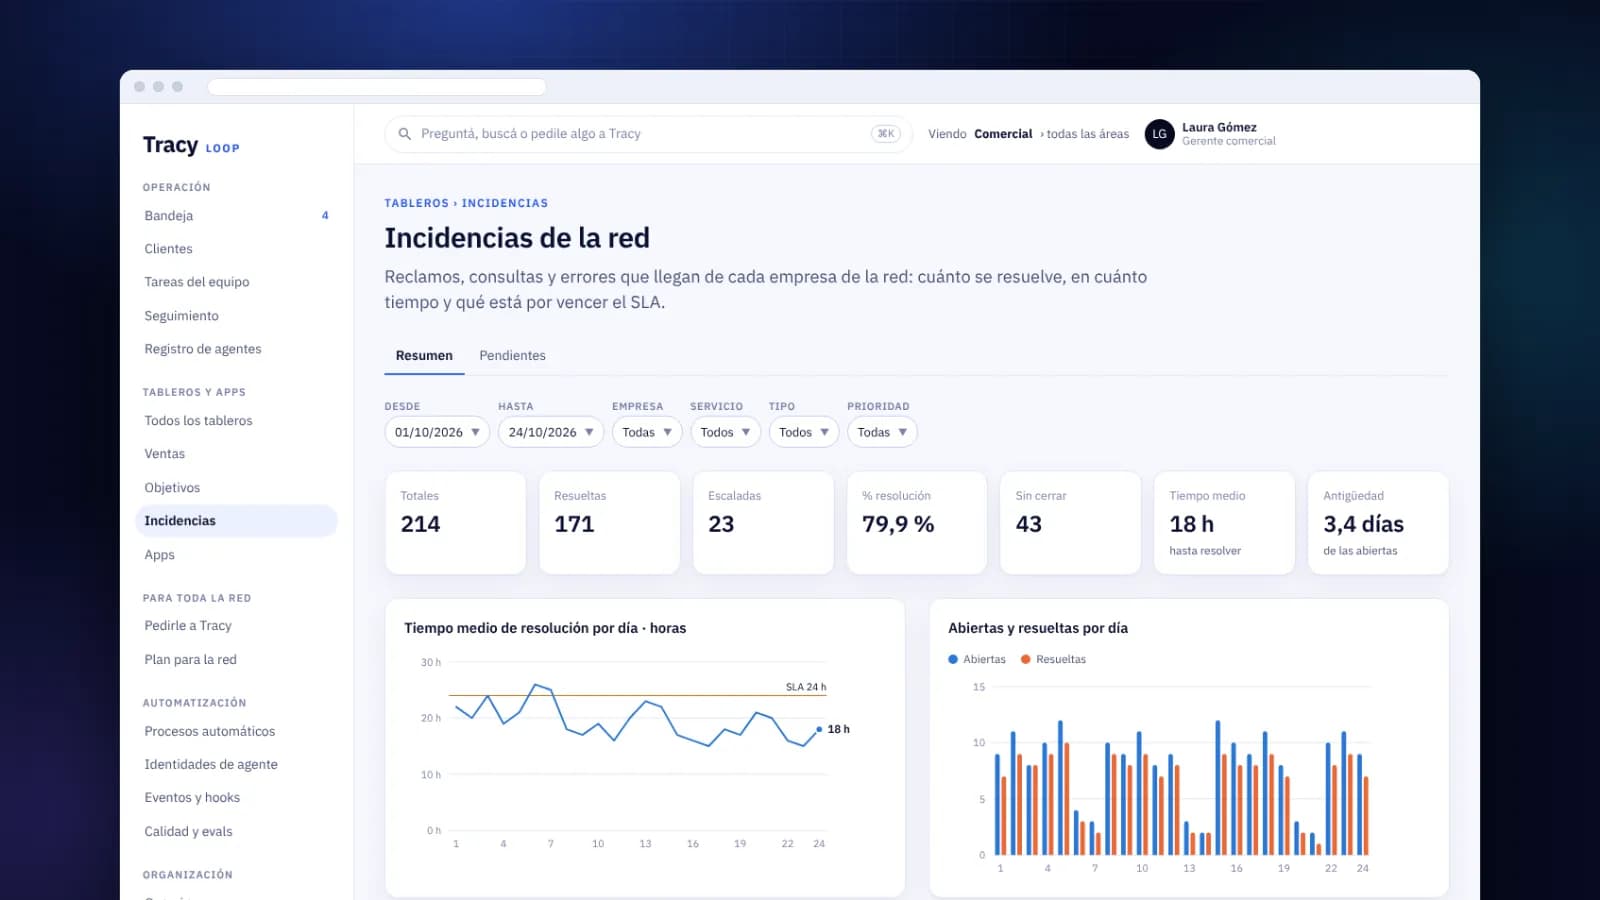
Open claims, resolution time and what's overdue, by company, service and priority.
Which customers stopped buying and which point-of-sale data needs fixing, with the action one click away.
Management sees the network, the supervisor their team and the sales rep their routes, with row-level security.
Your BI tool connects to the same views, so everyone looks at the same number.
From the orders, deliveries and claims that already go through Tracy, and from your integrated management system, without migrating anything.
Yes. Ask Tracy in the chat and it builds it as an app on the same views; you publish it for your area or for the whole company.
Yes. Every dashboard downloads as a spreadsheet, and you can schedule it to be sent.
No. Each person sees what's relevant to them based on their place in the org chart.
30 minutes to show you how it would look in your operation.